Naciones Unidas       CEPAL       División de Desarrollo Social      
Acerca    Contacto          Español - English
Youth and Social Inclusion
Youth Observatory for Latin America and the Caribbean
«Home
People who do not self-declare to be afro-descendant or indigenous
Source: ECLAC, based on special tabulations of data from household surveys.
Published: 2019-01-10 13:22:35 | Updated: 2019-01-14 15:15:37
Options   How to start?
Mandatory variables, filter respond to the minimum you should select to access the information in this publication, graphics, statistics and data in the study.
Mandatory variables
Country
Hide selected variable in crosstab (use only as filter)
Survey Waves
Hide selected variable in crosstab (use only as filter)
Optional variables correspond to the filters and want to obtain specific data on this publication.
Optional variables
Sex
zone
Age range
Nivel educativo
Income quintile

Select the Display options to choose to process the required information.
Display options
Subtotals:
(Computation of subtotals may delay output)

Type of computation

Decimals

Decimal notation

Thousands separators

Show notes at end of table (faster)
Display warning note about small sample sizes
Technical report

Getting started

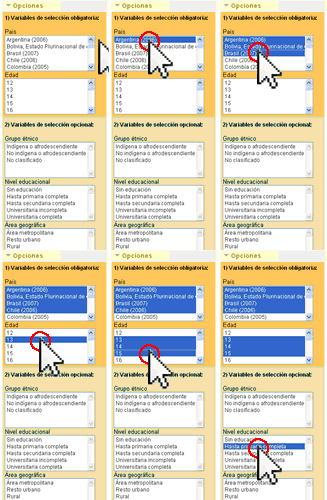
To calculate the indicator, select the mandatory and optional variables that you wish to cross-reference. The optional variables, only available for dynamic indicators, correspond to the specific filters and data that you can receive from this indicator. Depending on the variables, you will be able to access, for example, information sorted by geographic area, sex, income quintiles, etc.

In each variable, one or more available categories can be selected by simply clicking and dragging the mouse cursor across the relevant categories. The same result can be achieved using the keyboard, by holding shift while pressing the up and down arrows. After making the selections, click the process button at the bottom of the box, this will open a new page displaying the results, which can then be exported to Excel.

Another way to analyse indicators is to select the “Easy chart” tab. This will allow you to automatically create graphs based on indicator variables. These can then be exported as image files (.png, .syg or .jpg) or as a PDF. Graphs are only available for dynamic indicators.

Click here for more information


  Youth Observatory for Latin America and the Caribbean
Social Development Division, United Nations ECLAC
3477 Dag Hammarskjöld Ave., Vitacura, Santiago, Chile
P.O. Box 179-D Telephone +56 2 2210 2525
© - All Rights Reserved.

Site Map  |  ReDeSoc  |  Social Development Division  |  ECLAC  |  OIJ